
Key facts
- EUR/USD live price: 1.1214
- Day change: +0.52%
- Month change: −2.84%
- RSI 14 (1d): 41
- Nearest resistance (4h): 1.1243
EUR/USD is hovering near 1.1214, with sellers still in control for now.
EUR/USD trades at 1.1214, down 2.84% over the month even as the dollar has been mixed into US inflation data. Bearish EMA alignment on the daily chart (9/20/50) and an RSI 14 of 41 point to continued softness, though the day change of +0.52% shows some short-term pushback. Price could stay choppy as traders wait on the CPI-linked data flow this week.
EUR/USD trades near 1.1214, down 2.84% over the month
The pair has slipped from its 50-day averages, with EMAs 9/20/50 aligned lower on the daily chart.
RSI 14 sits at 41, consistent with a cautious near-term tone rather than a sharp reversal.
Dollar demand into US CPI week may be weighing on the euro
Reports describe mixed dollar trading ahead of US inflation data, while a separate Treasury rally has reportedly lifted gold and pressured the dollar elsewhere.
These cross-asset flows could be part of what's pressuring EUR/USD, though the move also fits the broader bearish technical trend.
Traders may watch key levels and this week's US data
Nearby 4h support at 1.1215 and resistance at 1.1243 could shape short-term direction.
US Retail Sales and PPI data, due Thu 15 Oct 12:30 UTC, could also add volatility to EUR/USD into the week's close.
The chart right now
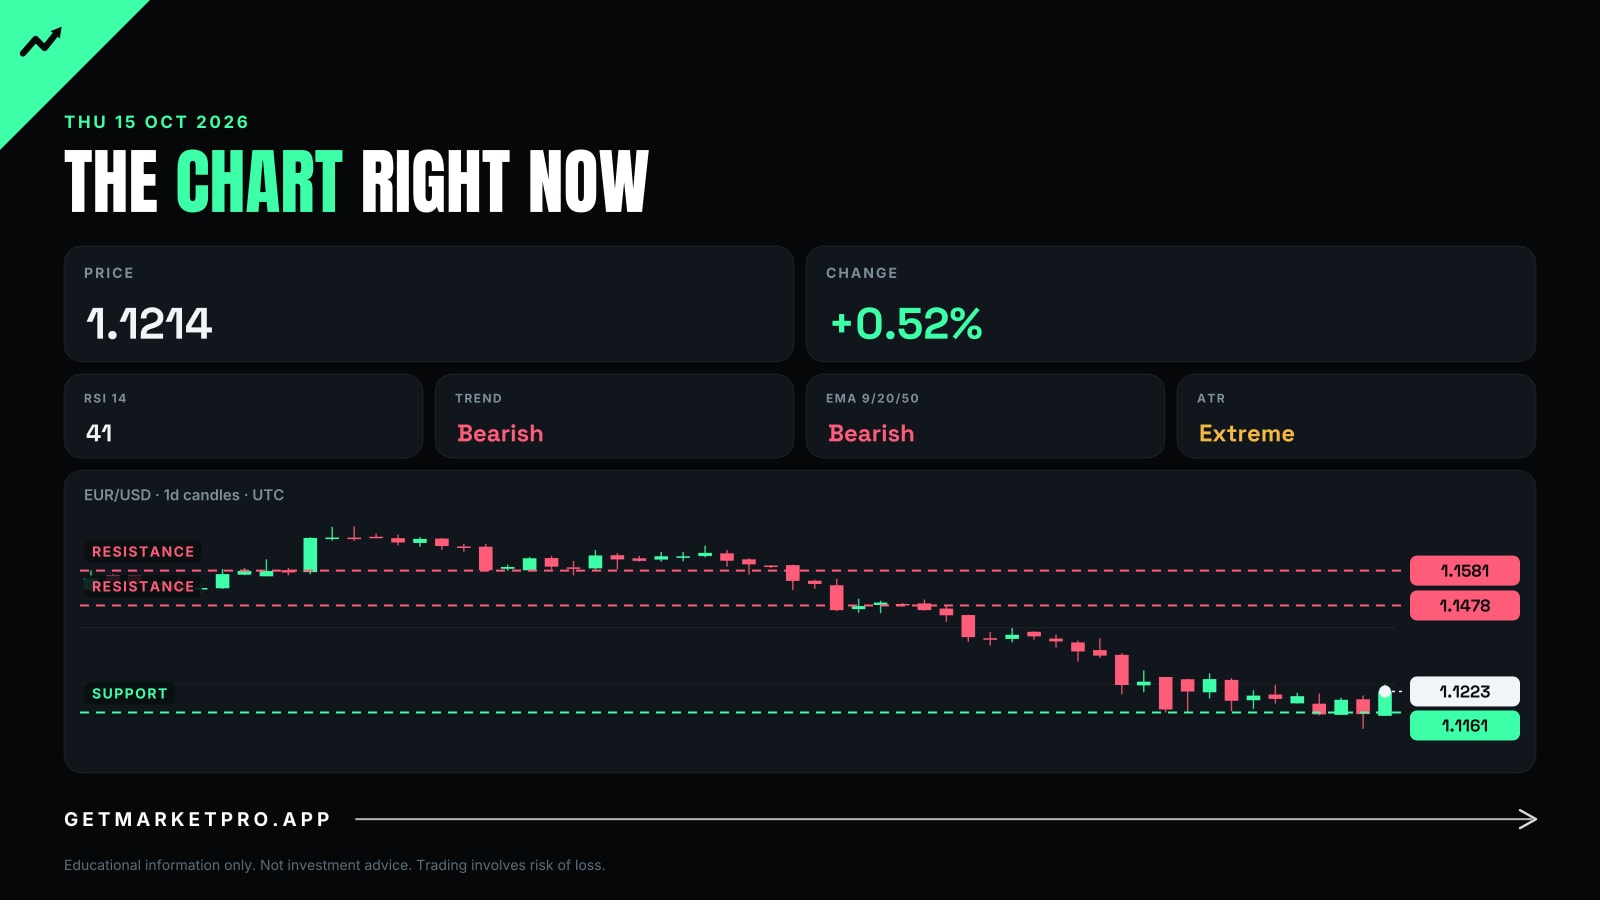
- Resistance: 1.1478
- Support: 1.1161
What to watch
- Whether EUR/USD holds above 1.1215: this is the nearest 4h support; a sustained break below could open room toward 1.1161.
- Whether EUR/USD can clear 1.1243: this is the nearest 4h resistance; a move above may ease some near-term bearish pressure.
- US Retail Sales and PPI data, Thu 15 Oct 12:30 UTC: these releases could shift dollar demand and add volatility to EUR/USD into the week's close.
Educational information only. Not investment advice. Trading involves risk of loss.